DailyPi
Daily tasks, events & weather on a battery-powered e-paper frame
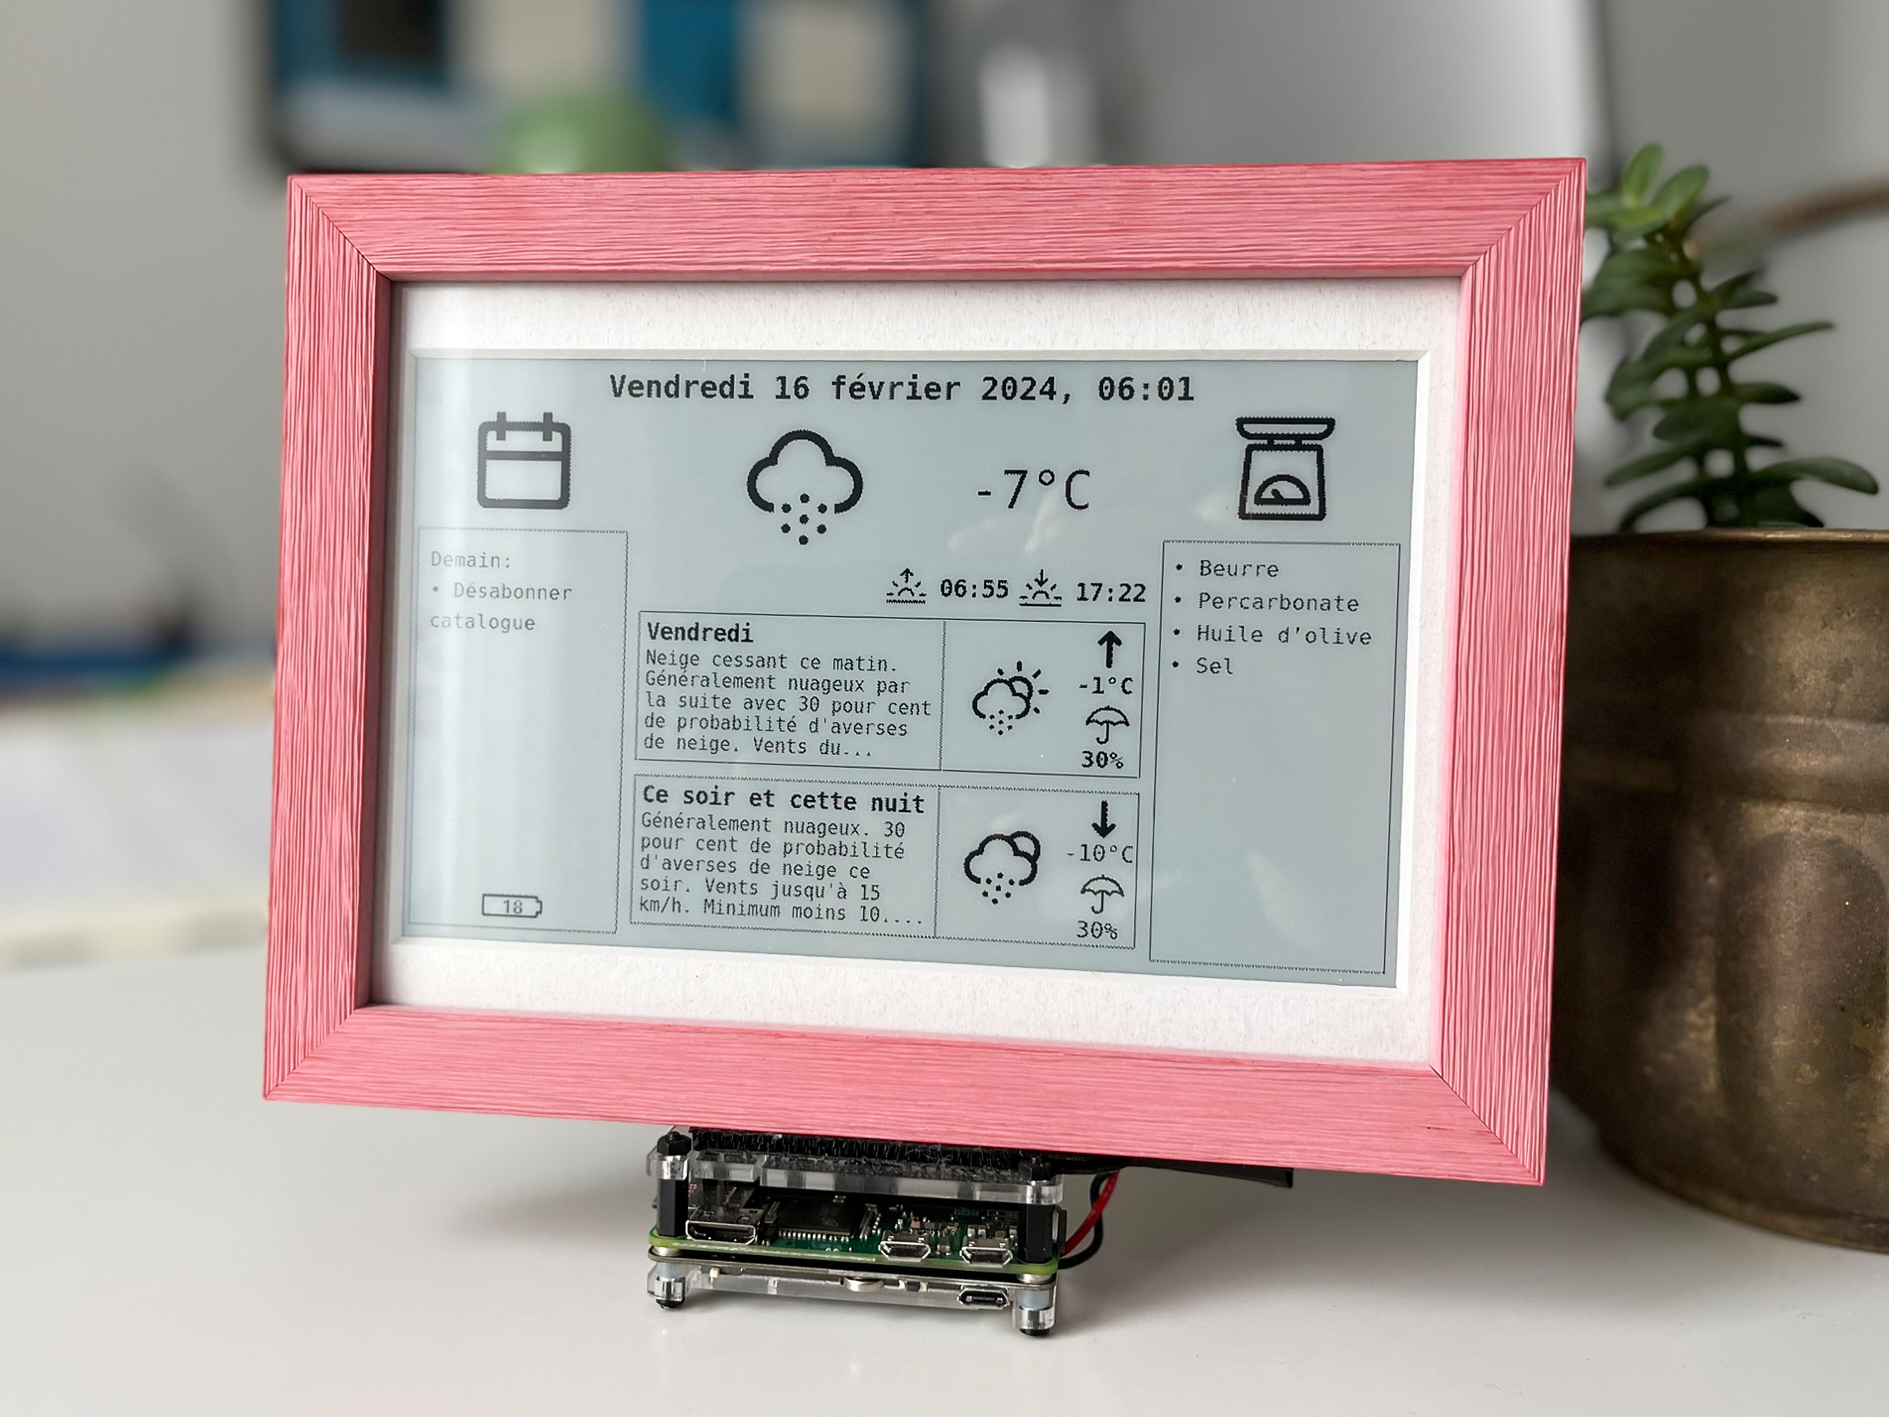
DailyPi is a straightforward home dashboard that shows daily tasks, events and weather on a 7.5 inch e-paper screen. I wanted to have a small, unobtrustive frame that would give me the day’s info at a glance.
All of the data preparation is conducted server-side, through a web app hosted on Google Cloud Run, which collects information from multiple APIs and outputs a PNG image at a fixed URL. The local device is composed of a Raspberry Pi zero W computer physically wired to an e-ink screen. The Pi’s task is to regularly refresh its PNG image by pulling it from the server.
The code for DailyPi is available here on GitHub. and you can start the tutorial here.
To make the device portable, I connected it to an external battery, a PiSugar2 battery that plugs in directly to the Pi’s board and lets you connect other components, such as HATs. With three refreshes a day and a wake time of two minutes, I am able to make the battery last roughly 3 weeks. The really cool thing about e-paper is that any image will continue displaying even without power, as the panel is made up of thousands of physical microcapsules of pigment that are physically reshuffled around by electricty. I would like to move to a Pico or ESP32 microcontroller in the future, to extend battery life much further.
This is my second e-ink project, and I aimed to make everything as simple as possible to maintain. I implemented a few time-saving features, such as a dynamic SVG template and continuous deployment from Github to Cloud Run.
I created the dashboard’s interface in French, but the fields could easily be customized through code by swapping variable names.


What you need
- A Google Cloud Platform account with billing enabled
- A pair of Raspberry Pi zero W with empty microSD cards
- You can find the Pi Zero board on Amazon here, although the price might be better at smaller local retailers, such as here on PiShop.ca
- I bought the board without headers and added GPIO headers with a solderless hammer header kit, as I didn’t feel like fussing over soldering
- This pair of Sandisk 32GB microSD cards should work fine for the project
- One Waveshare 7.5” e-ink screen for Raspberry Pi
- A computer to configure the Raspberry Pi microSD card and run terminal commands (I’m using a Macbook, but powershell on Windows works much the same!)
How it works
I know how time-consuming tech projects can be - it always takes longer than planned to carry out what you had in mind. Mostly, I wanted to create something simple to develop and maintain.
The UI is built from an SVG file, a file format can be opened either as an image or as code. Since you can edit its code on the go, you can dynamically update fields and elements, to refresh data printed to the canvas. This idea is popular with e-paper projects, such as Mendhak’s e-paper dashboard, Sevesalm’s e-ink weather display and r-mathieu’s train map display.
I created the SVG template from scratch in Adobe Illustrator, matching the frame’s resolution (800 x 480 pixels). I then formatted all of the object fields and names by manipulating the SVG code in Vscode. An online editor such as BoxySVG can be especially useful to update the SVG graphics without messing up the order of the code and the custom object names. Alternating between Adobe Illustrator and Vscode is often destructive, since Illustrator will re-order the code and wipe out your custom code changes.

The data
The dashboard’s data is pulled from three sources :
- Google Calendar, for daily events
- Google Tasks, for grocery/to-do lists
- Environment Canada, for weather forecasts, through the amazing env_canada library built by MichaelDavie. Basically, this is a wrapper that interprets the XML information published for local weather stations multiple times per day (here is Châteauguay’s page, for example).
All Google authentication is handled via Oauth 2.0 tokens, which can be generated during testing and then refreshed automatically server-side.
Weather icons
The icons used by Environment Canada are pretty low resolution, and so I decided to pick a new set of icons and then match them one-to-one to the icon descriptions used by Environment Canada, which is no small feat! Try finding the difference between ‘Light rain shower and flurries’ (icon code 37) and ‘A few wet flurries’ (icon code 38)…
I found the description of each icon code here and painstakingly matched them to erikflowers’ great SVG iconset available here, licensed under SIL OFL 1.1. The index of all matches is in the project repo here All SVG files were dropped as individual objects into the SVG file, with a special attribute setting their visibility to ‘hidden’. The app scripts dynamically reveal the right weather icons depending on the forecast emitted by Environment Canada.

